RX Session: Advanced Dashboards with Jason Gibb
During RX 2024, Jason Gibbs shared a variety of dashboards that can be built to showcase your data in Rock RMS. Dashboards are often requested because they simplify data interpretation, improve decision-making, and effectively communicate insights. Visually appealing dashboards make complex data more accessible and easier to understand at a glance. With the right tools, you can deliver these requests efficiently.
During the session, Jason categorized the dashboards by different skill levels. Whether you are a beginner or more experienced, we want to empower you to build engaging dashboards for your metrics.
Rock Metric Dashboard (Level 1 - Beginner):
Skill Level: Low
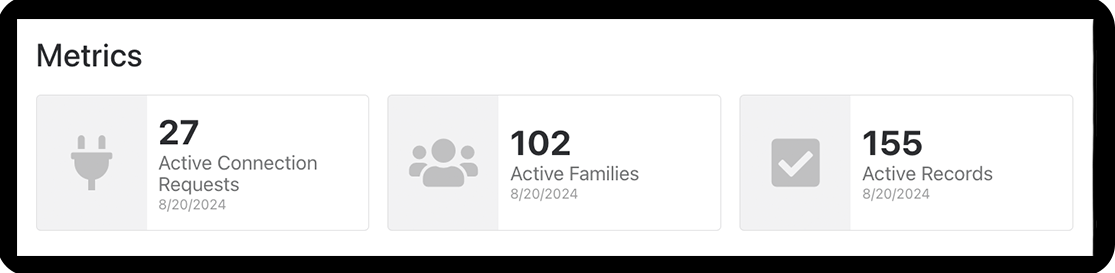
Rock includes in-house dashboards built into the home page, displaying metrics for active connections, families, and records. This dashboard is straightforward, requiring no coding or advanced configuration, making it accessible for users with basic Rock literacy.
You can easily add to this board. Here's how:
1. Select or add a new metric from the list found in Tools > Reporting > Metrics.
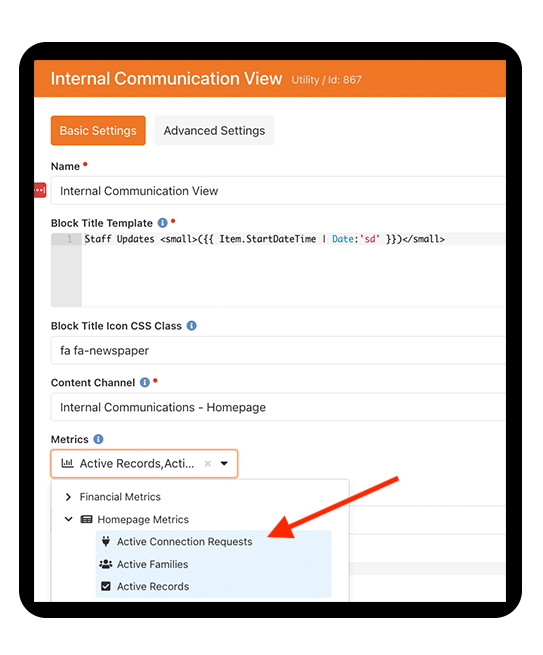
2. On the Rock home page, go to the block settings of the Internal Communication View and highlight the metrics you want to add to the dashboard.
That's it!
SQL Driven Dashboard (Level 2 - Intermediate):
Skill Level: Moderate
This intermediate dashboard, demonstrated during the session, has been made more accessible by providing the SQL script for you. Although we've simplified the process, you will still need basic skills in adding blocks, creating metrics, and customizing the SQL to fit your database.
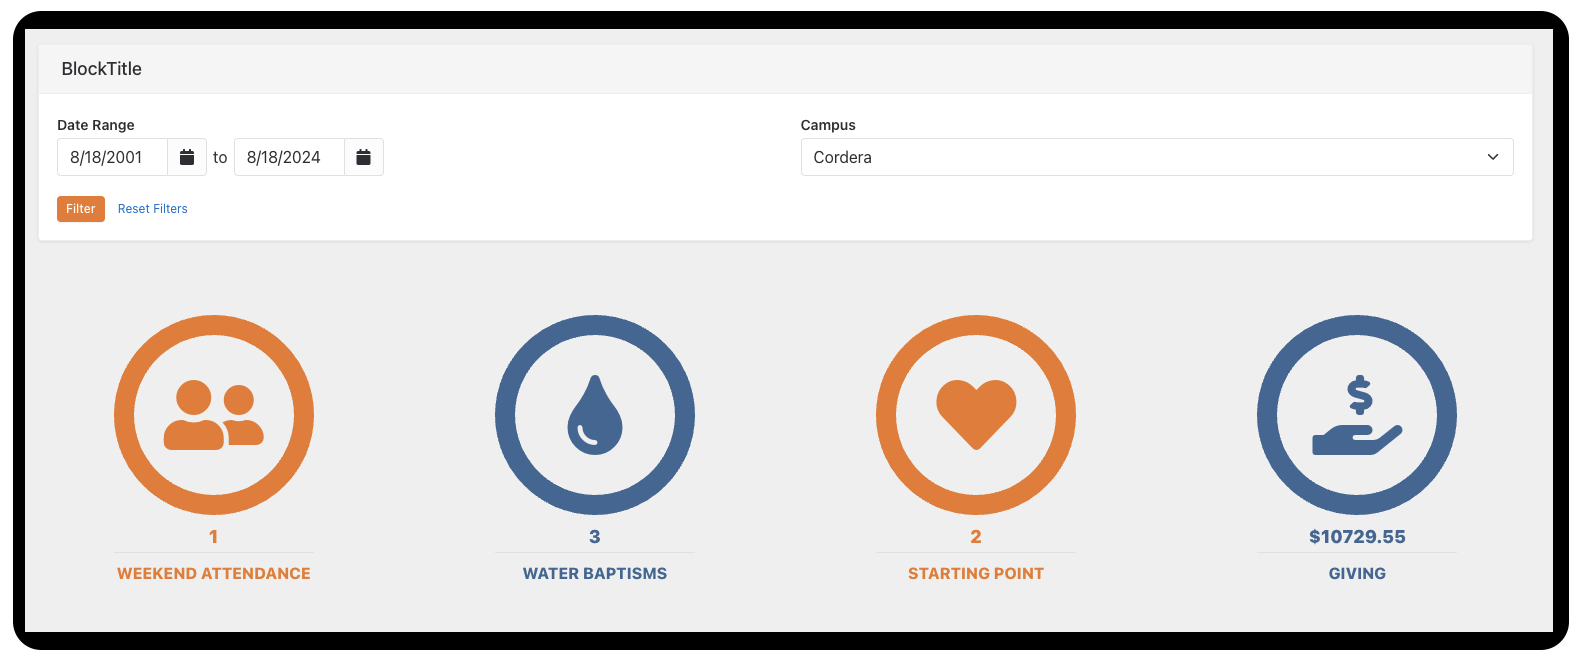
This dashboard is intentionally designed with a variety of metrics to allow for easy customization based on your needs. For example, "Weekend Attendance" pulls from a metric, "Water Baptisms" pulls from an attribute, "Starting Point" pulls from a Step type ID, and "Giving" pulls from financial transaction data.
This Dashboard is constructed using two blocks:
1. Page Parameter Filter
2. Dynamic Data
Page Parameter Setup:
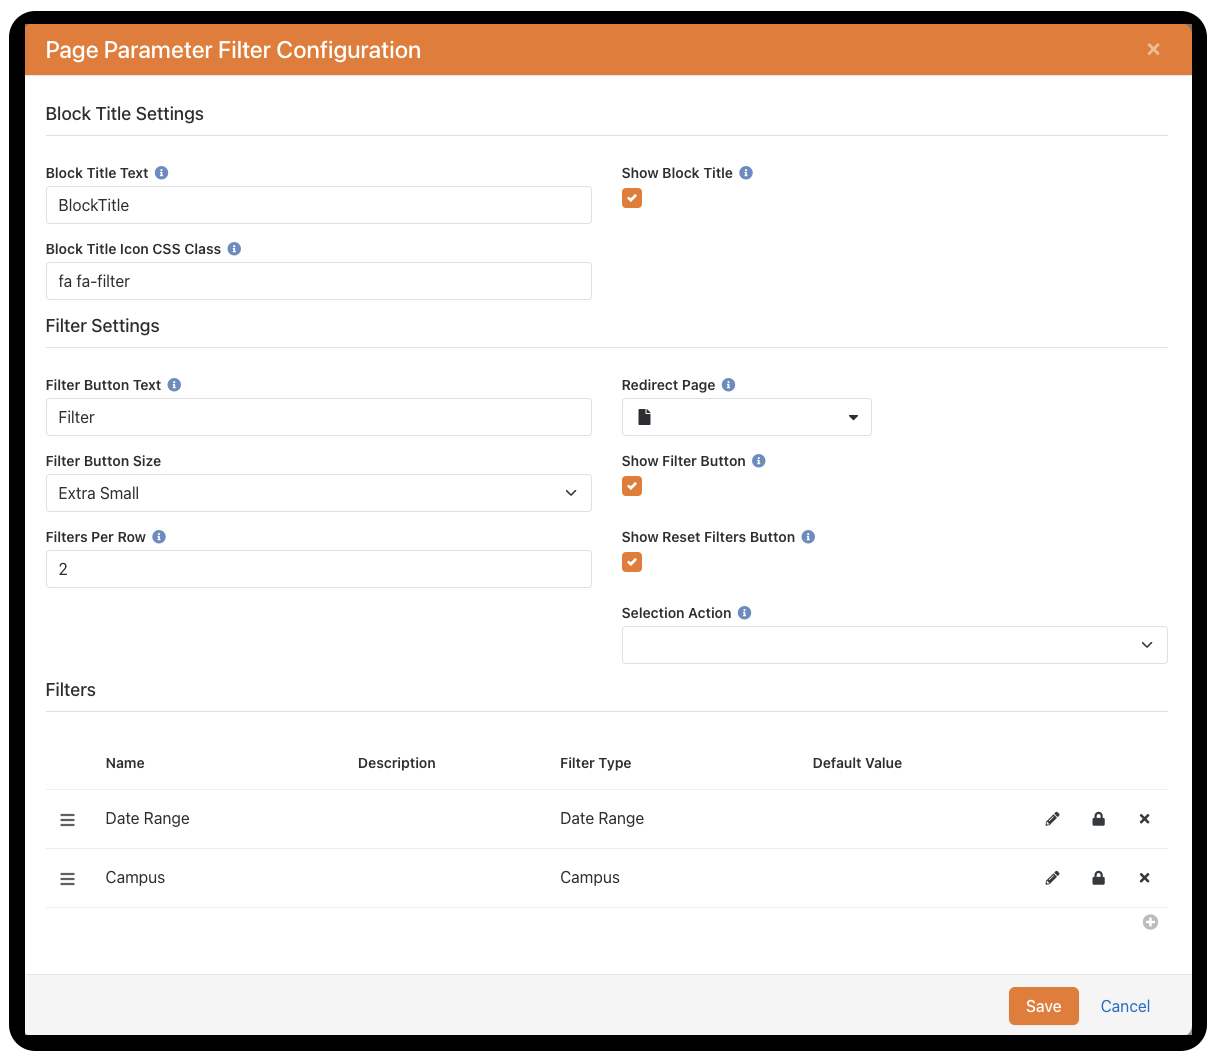
Add a Page Parameter block. Set the Filter's as shown in the screenshot below.
- Date Range
- Campus (Use CampusID for your key)
Dynamic Data Block Setup:
Use the screenshot below as a guide to set up the Dynamic Data Block. The "Query" and "Formatted Output" details are provided below. Click the gear icon and make sure to enable both "Rock Entity" and "SQL" in the Basic Settings.
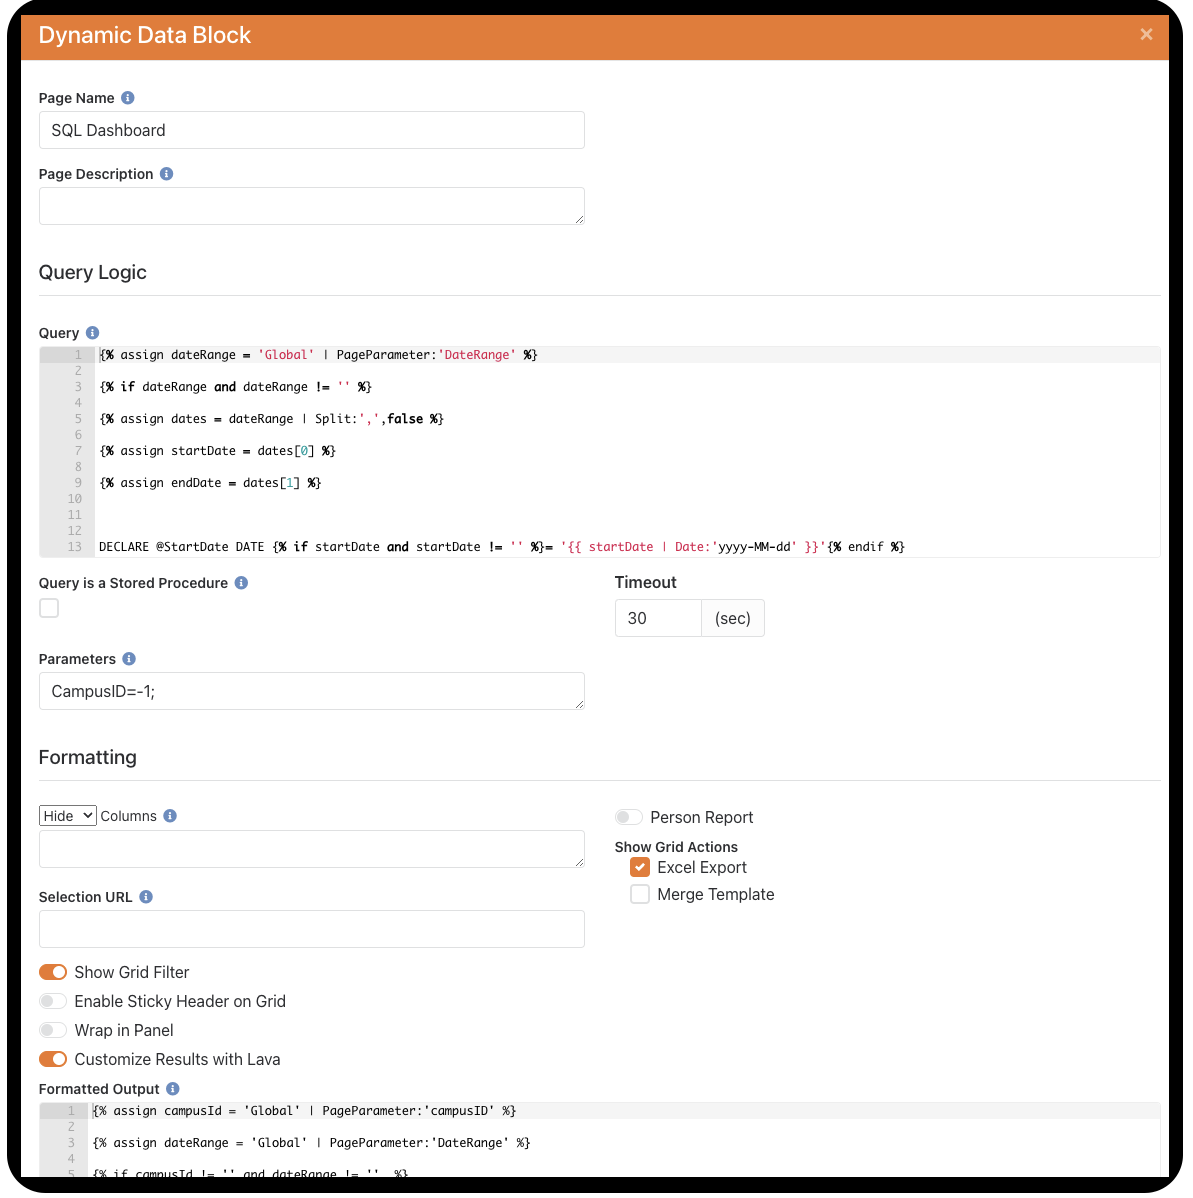
Get Query Code
Modify the query logic to fit your specific needs. Each section of the query is clearly labeled for easy customization. For example, line 35 of the query refers to "Water Baptisms" and uses the attribute ID of 174. Every section of the dashboard is labeled, allowing you to make adjustments tailored to different types of dashboard reporting.
Get Formatted Output Code
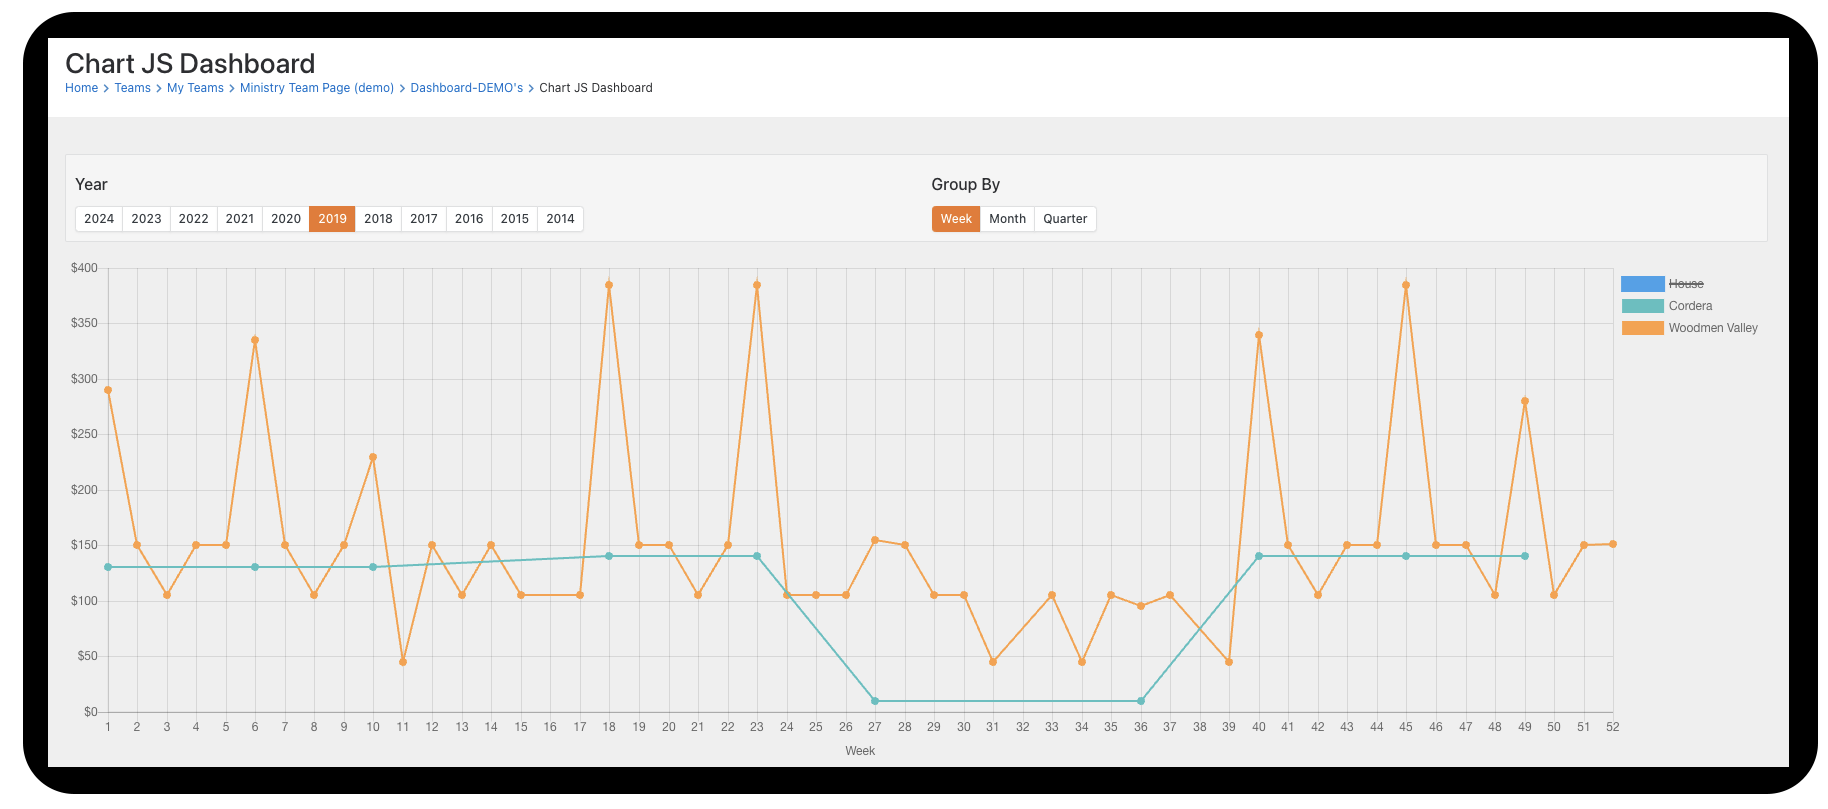
Chart JS Dashboard (Level 3 - Advanced):
Skill Level: High
This advanced dashboard has been made more accessible by providing the SQL script for you. However, you will still need basic skills in adding blocks, creating a Lava Webhook, and customizing the SQL to fit your database.
This dashboard is constructed using three key components:
1. Lava Webhook
2. HTML Block
3. Script in Header Content
Webhook Setup:
1. Navigate to Admin Toolbox > General Settings > Defined Types > Lava Webhook.
2. Add a new Lava webhook. This webhook will retrieve the data needed for financial trends.
- Set the value as: /FinancialTrendsCampus
- Method: GET
- Enabled Lava Commands: Cache, SQL
- Response Content Type: application/json
- Add Webhook Code
Get Webhook Code
HTML Block:
Add an HTML block to the page your ChartJS Dashboard will be. Add the ChartJS Code.
Get Chart JS Code
Note: If you search for "FinancialTrends" in the code, you’ll find the webhook embedded within it. After the webhook, you’ll also see the parameters that help filter the data.
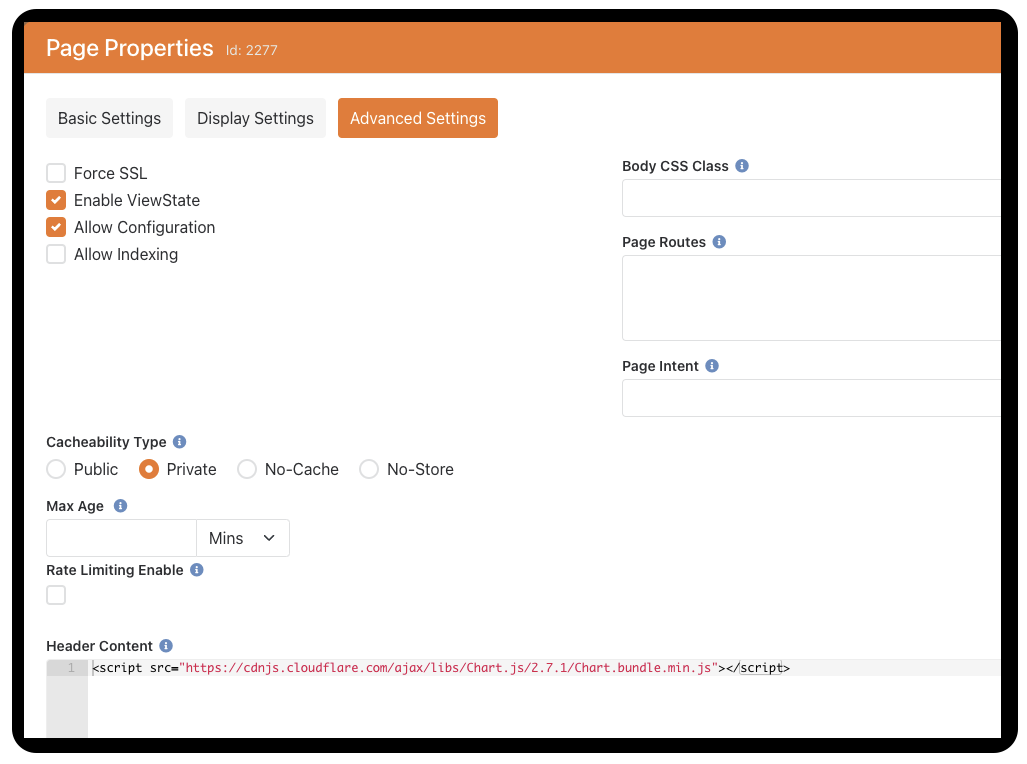
Script in Header Content:
In the Page Settings of your dashboard page, navigate to the Advanced Settings tab. Then, add the script to the "Header Content" section.
{[ codify ]}{[ endcodify ]}
As you can see, there are multiple ways to display data for your teams and leadership. Incorporating these dashboards can significantly enhance your ability to track and interpret key metrics. Whether you prefer simple, built-in solutions or advanced custom dashboards, there’s a tool and approach that suits everyone. We encourage you to explore these options and start building dashboards that will make a real impact in your organization. If you have any questions or would like to contact our team about building a custom dashboard for you, click the Contact Us button below.